Before doing these problems, read the queueing networks tutorial linked to the CS471 or CS571 websites. For a handy reference, there is a summary of queueing formulas also linked to the site. The Queueing slides in The Art of OS may also be helpful.
NOTE: Explain or justify your answers. A simple "yes" or "no" does not reveal whether you understand or whether you merely guessed right.
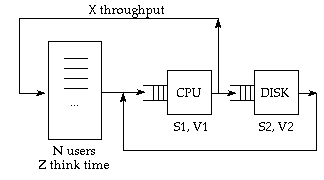
This figure depicts the servers of a simple time-sharing computer system. The parameters of this system are defined in the tutorial notes and slides. The MVA (Mean Value Analysis) algorithm computes four performance measures of the system: Qi is the mean length of queue at server i (including the job in service plus any jobs waiting), Ti is the mean residence time per visit at server i (the mean response time per visit times the number of visits), R is the mean response time of a job in the system, X is the throughtput of the system, and Xi is the throughput at the output of server i. The algorithm uses the demands, Di = Si*Vi, plus think time Z and total job load N as parameters. The algorithm computes the metrics for loads 1,2,...,N, so you get a bonus of the metrics for all lower loads. Here is a sketch of the MVA algorithm:
   set all Qi[.], Ri[.], Xi[.] = 0
   for k=1,...,N do {
      Ti[k] = Di*(1+Qi[k-1]) for all i
      R[k]  = sum{Ti[k], for all i}
      X[k]  = k/(R[k]+Z)
      Qi[k] = X[k]*Ti[k], for all i
      }
Here are the base parameters of a system:
   D1     =  5 sec. (total CPU time per job)
   S2     =  50 msec.
   V2     =  100 disk visits per job
   Z      =  40 sec.
(1) Make up a complete parameter chart: a table with one column for each server and one row for each of {Vi, Si, Di}. List N and Z at the bottom of your table.
(2) What server is the bottleneck of this system? Explain.
(3) Someone observes the system and measures the mean response time at 2 minutes. How many users are logged in?
(4) Is mean response time 30 seconds feasible when 20 users are logged in?
(5) Would a CPU 2x faster make 30-second response time feasible when 20 uers are logged in?
(6) Would a new I/O caching method that cuts the number of disk visits in half make 30-second response time feasible when 20 users are logged in?
(7) Would both the faster CPU and less-visited disk make 30-second response time feasible when 20 users are logged in?
(8) Suppose that the system is configured with both the faster CPU and the less-visited disk. How many users can be logged in with response time no worse than 30 seconds?
(9) Program the MVA algorithm on a spreadsheet. Set the precision of number format to 3 digits after the decimal point. Compute the mean response time curve R(k) and throughput curve X(k) for k=1,2,...,N and N=50 in the original system and also in the modified system of question 8. Plot these graphs: R(k) and asymptote versus k, original system; X(k) and asymptote versus k, original system; and R(k) and asymptote versus k in the modified system of question 8. (As a calibration point, you should find T2(10)=13.408 in the original system.)
(10) Suppose that we configure the system with the faster CPU and two of the original disk units in parallel, and we distribute the data between the disks equally. How does this configuration compare with the one considered above in question 8? Plot R(k) for the original system, the modified version of question 8, and the modified version of question 10 on the same graph. Discuss.