Lifetime Function


In the discussions about replacement policies
and the LRU stack algorithm, the derivation of
the fault rate curve was explained.

Now, look at the fault rate curve again without the page
faults individually broken out (left above). This curve is often
referred to as F(m), m= number of page frames. The curve
descends as the number of page frames is increased from one fault per
page reference when no page frames are used to the minimum of nine (one
for each page) when nine page frames are used. Notice that it does not
descend uniformly. After descending sharply, it levels off and then
descends sharply again.
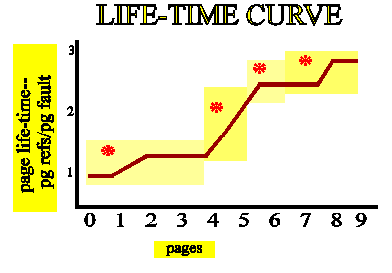
The curve known as the LIFETIME CURVE is the inverse of the
fault rate curve (right above). This curve is referred to as L(m).
It represents the average "lifetime" of a page in main memory. That
is, the average number of page references that occur in the process
before a page is replaced. Now the curve rises sharply, levels off and
then rises sharply again. Although this particular curve was generated
by a specific reference string (the
column matrix multiplication), the basic shape it takes is typical of
lifetime curves.
The lifetime curve is represented in the picture below with sections
marked off by yellow rectangles each containing a red star. Click on a
star to obtain a description of the characteristics of that part of a
typical lifetime curve.


The lifetime curve represented above was computed using a section of the reference string of the code for computing matrix multiplication by column. Given the following reference string from a section of code for a sort, compute the lifetime curve.
Does this lifetime curve have a knee? Where?

