Probability Distributions


Let's take a look at an example--
Suppose that a coin is tossed twice so that the sample space
S = {HH, HT, TH, TT}. Let X be the number of heads which can come up. With each sample point, we can associate a probability distribution for the variable X in the range space from 0 to 2 as in the table below. Thus, in the case of HH (2 heads), X = 2 while for TH (1 head), X = 1.

What is the probability distribution for this experiment?
The probability distribution for the experiment is as
follows:
| Sample Point |
HH |
HT |
TH |
TT |
| X |
2 |
1 |
1 |
0 |
In the above table, X = 2 means that 2 heads came up in two tosses of the coin,
X = 1 means that 1 head and 1 tail came up. And X = 0 means that 2 tails came up.

 Haaaaah!!! Are you ready for another example?
Suppose that two of fair dice are tossed. This time, let the
random variable X denote the sum of the points.

What is the sample space and what is the probability distribution for this experiment?
In the Sample Space below, the first number of the ordered
pair is the number showing on the first die, and the second number
is the number showing on the second die. Notice that there are thirty-six possible results so the sample space has thirty-six elements.
Sample Space
| (1, 6) |
(2, 6) |
(3, 6) |
(4, 6) |
(5, 6) |
(6, 6) |
| (1, 5) |
(2, 5) |
(3, 5) |
(4, 5) |
(5, 5) |
(6, 5) |
| (1, 4) |
(2, 4) |
(3, 4) |
(4, 4) |
(5, 4) |
(6, 4) |
| (1, 3) |
(2, 3) |
(3, 3) |
(4, 3) |
(5, 3) |
(6, 3) |
| (1, 2) |
(2, 2) |
(3, 2) |
(4, 2) |
(5, 2) |
(6, 2) |
| (1, 1) |
(2, 1) |
(3, 1) |
(4, 1) |
(5, 1) |
(6, 1) |
In the Probability Distribution Table below, X is the
sum of the two numbers showing on the dice. If X = 2, the
number showing on the first die must be one and the second die also is one.
The distribution table shows there is only one chance out of thirty-six that both dice show one. When X = 3, the first die shows 1 and the second die shows 2 or vice versa. Thus there are two chances in thirty-six of this happening.
| x |
2 |
3 |
4 |
5 |
6 |
7 |
8 |
9 |
10 |
11 |
12 |
| f(x) |
1/36 |
2/36 |
3/36 |
4/36 |
5/36 |
6/36 |
5/36 |
4/36 |
3/36 |
2/36 |
1/36 |

Probability Distribution refers to the frequency at which (or how often) some experiments or events happen
In general, Probability Distributions are classified into two categories:
-
Discrete Probability Distribution - If the distribution function is for a discrete random variable
X as in the example above, then the function is called discrete.
Continuous Probability Distribution. - If the distribution function is for a continuous random variable X, then the function is called continuous.
Measures of Central Tendency

Example:
-
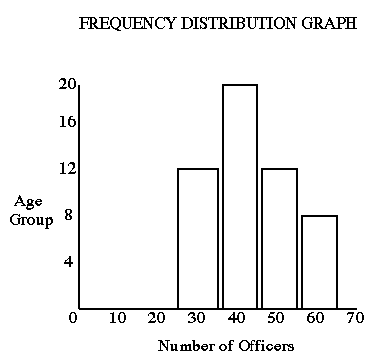
Consider a test given to a group of Aquisition officers and the result of the test is obtained as a distribution of numerical scores.
| Age Group | Number of officers |
| A: 25-35 | 12 |
| B: 36-45 | 20 |
| C: 46-55 | 12 |
| D: 56-65 | 8 |
-
The following graph shows the Frequency Distribution of the data presented above.

A frequency distribution is a summary of data. When comparing a distribution of data with another distribution, it is more efficient to compare only certain characteristics of the distributions. One useful set of characteristics of a distribution, is its measures of central tendency. The indices of central tendency are ways of describing the typical or the average value in the distribution.
How do we find measures of central tendency?
If you were asked to state one value that would best capture or communicate the distribution as a whole, which value should you choose? One answer is to find value which is a "good bet" about any randomly selected case from this distribution. Here are three different ways to specify what we mean by a good bet:
-
1. The most frequent (most probable) measurement class.
2. The point exactly midway between the top and the bottom halves of the distribution.
3. The arithmetic average of the distribution.
These three ways define the measures of central tendency and they are called mode, median and the mean of the distribution respectively.
How do we define the measures of central tendency?
 Mode
Mode - the midpoint or class name of the most frequent or most probable measurement class.
 Median
 - the measurement that divides the cases into two intervals having equal frequency.
 Mean
Mean - is the average of a set of measurements.
Now coming back to the above example, using the concept of measures of central tendency,
-
Mode is age group B (the largest group)
-
Mean = number of officers in each group * group number / total number of officers
=> mean = (12 * 1 + 20 * 2 + 12 * 3 + 8 * 4) / 52 = 2.3 = group B
Median = (54 - 25) / 2 + 25 = 38 = group B


 Haaaaah!!! Are you ready for another example?

 Mode
Mode