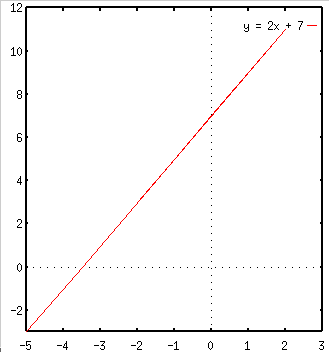
To graph a function such as f(x) = y = 2x + 7, we can select a table of values, plot and connect the points. To fill the table, we choose values for x and use the function to get the values of y as shown in the following table.
| x | -3.5 | -2 | -1 | 0 | 0.5 | 1 | 2> |
| y | 0 | 3 | 5 | 7 | 8 | 9 | 11 |

Plot the graph of a linear function 4x - 3y = 12.
Solution:
To plot the graph of a linear function, usually it is sufficient to plot the x and y intercepts of that
linear function.
From the above equation, we find that the x-intercept is 3 (i.e. when y = 0) and the y-intercept is -4 (i.e. when x = 0). For convenience,
we will also find another point: (x= 6, y=4). Now the graph can be plotted as following:
